Introduction
Data processing, sometimes referred to as data wrangling, data munging, is the process of transforming and mapping data from one “raw” form of data to another format with the intent of making it more relevant and valuable for various purposes, such as analytics. The goal of data transformation is to make data high quality and useful. Data analysts typically spend most of their time on data processing versus actual data analysis.
A recent article from the New York Times said “Data scientists, according to interviews and expert estimates, spend from 50 percent to 80 percent of their time mired in the mundane labor of collecting and preparing data, before it can be explored for useful information.”
Before an R program can look for answers, your data must be cleaned up and converted to a form that makes information accessible. In this chapter, you will learn how to use the dplyr, tidyverse and tr packages to optimise the data wrangling process.
You’ll learn to:
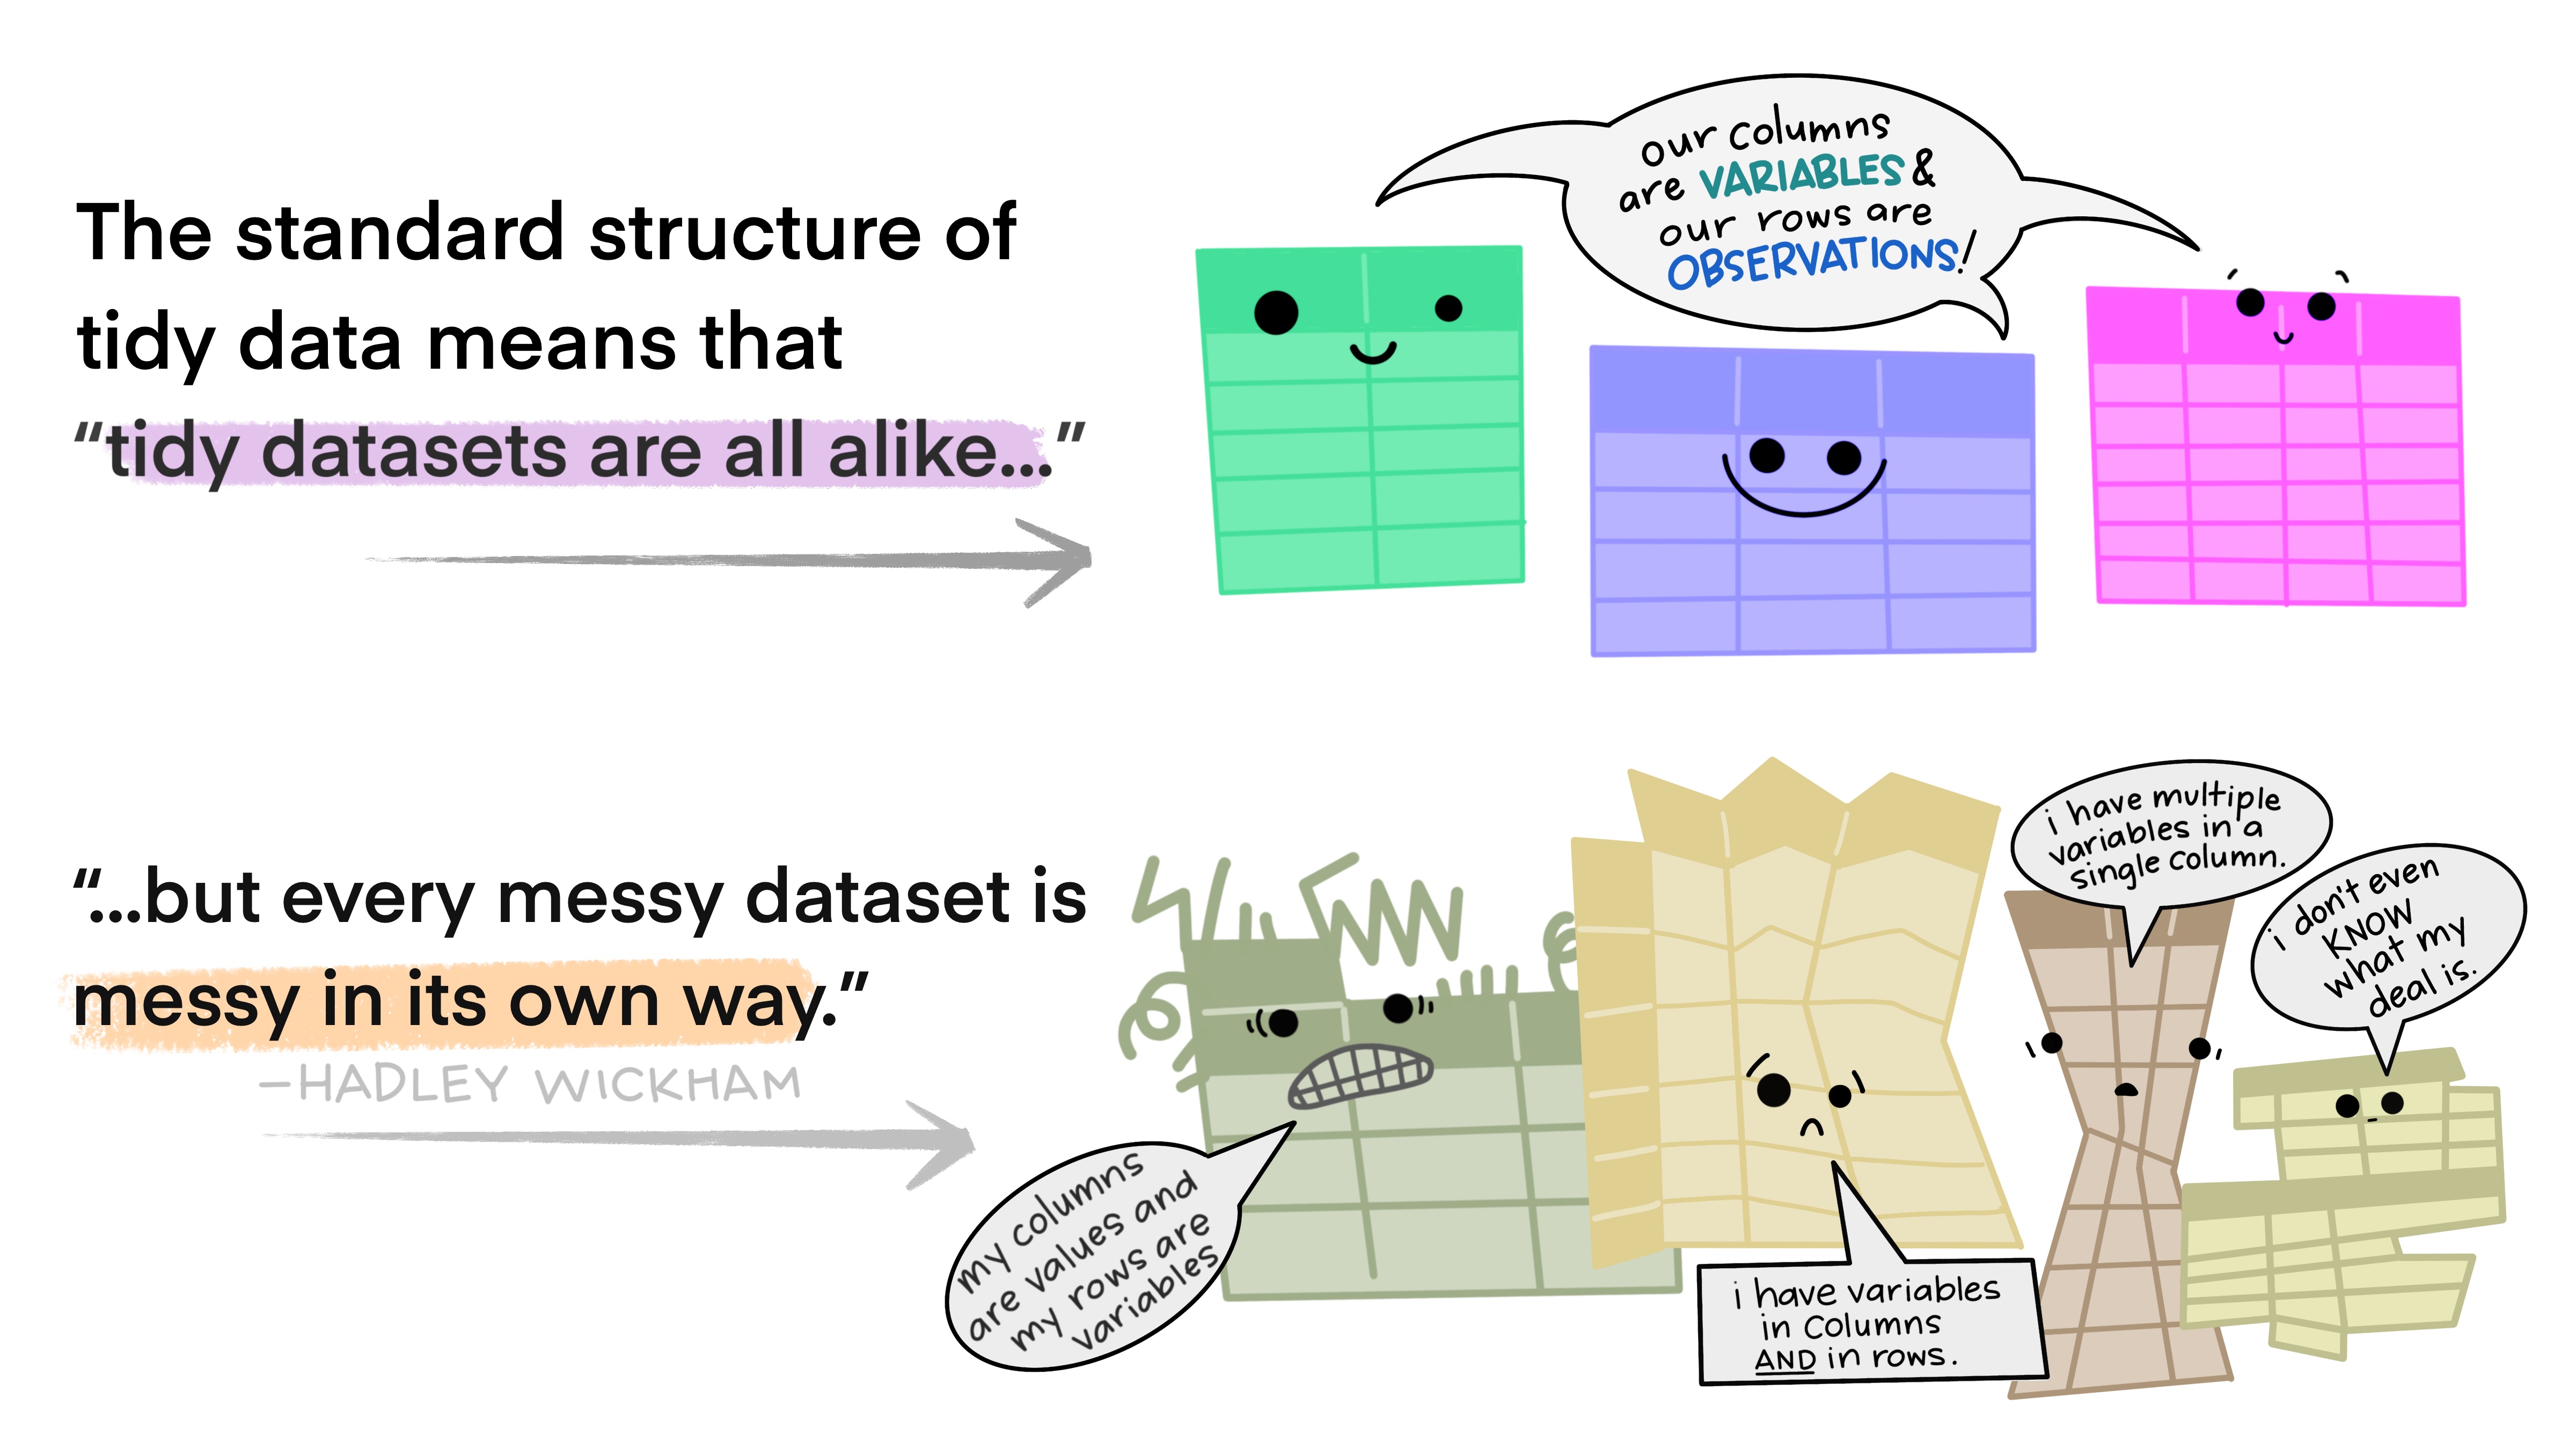
Spot the variables and observations within your data
Quickly derive new variables and observations to explore
Reshape your data into the layout that works best for R
Join multiple data sets together
Use group-wise summaries to explore hidden levels of information within your data
Before continuing, please install all the packages in the tidyverse by running install.packages("tidyverse").
Run library(tidyverse) to load the core tidyverse and make it available in your current R session.
Learn more about the tidyverse package at https://tidyverse.tidyverse.org.