
Chapter 5 Data Manipulation
 ## Tidy data
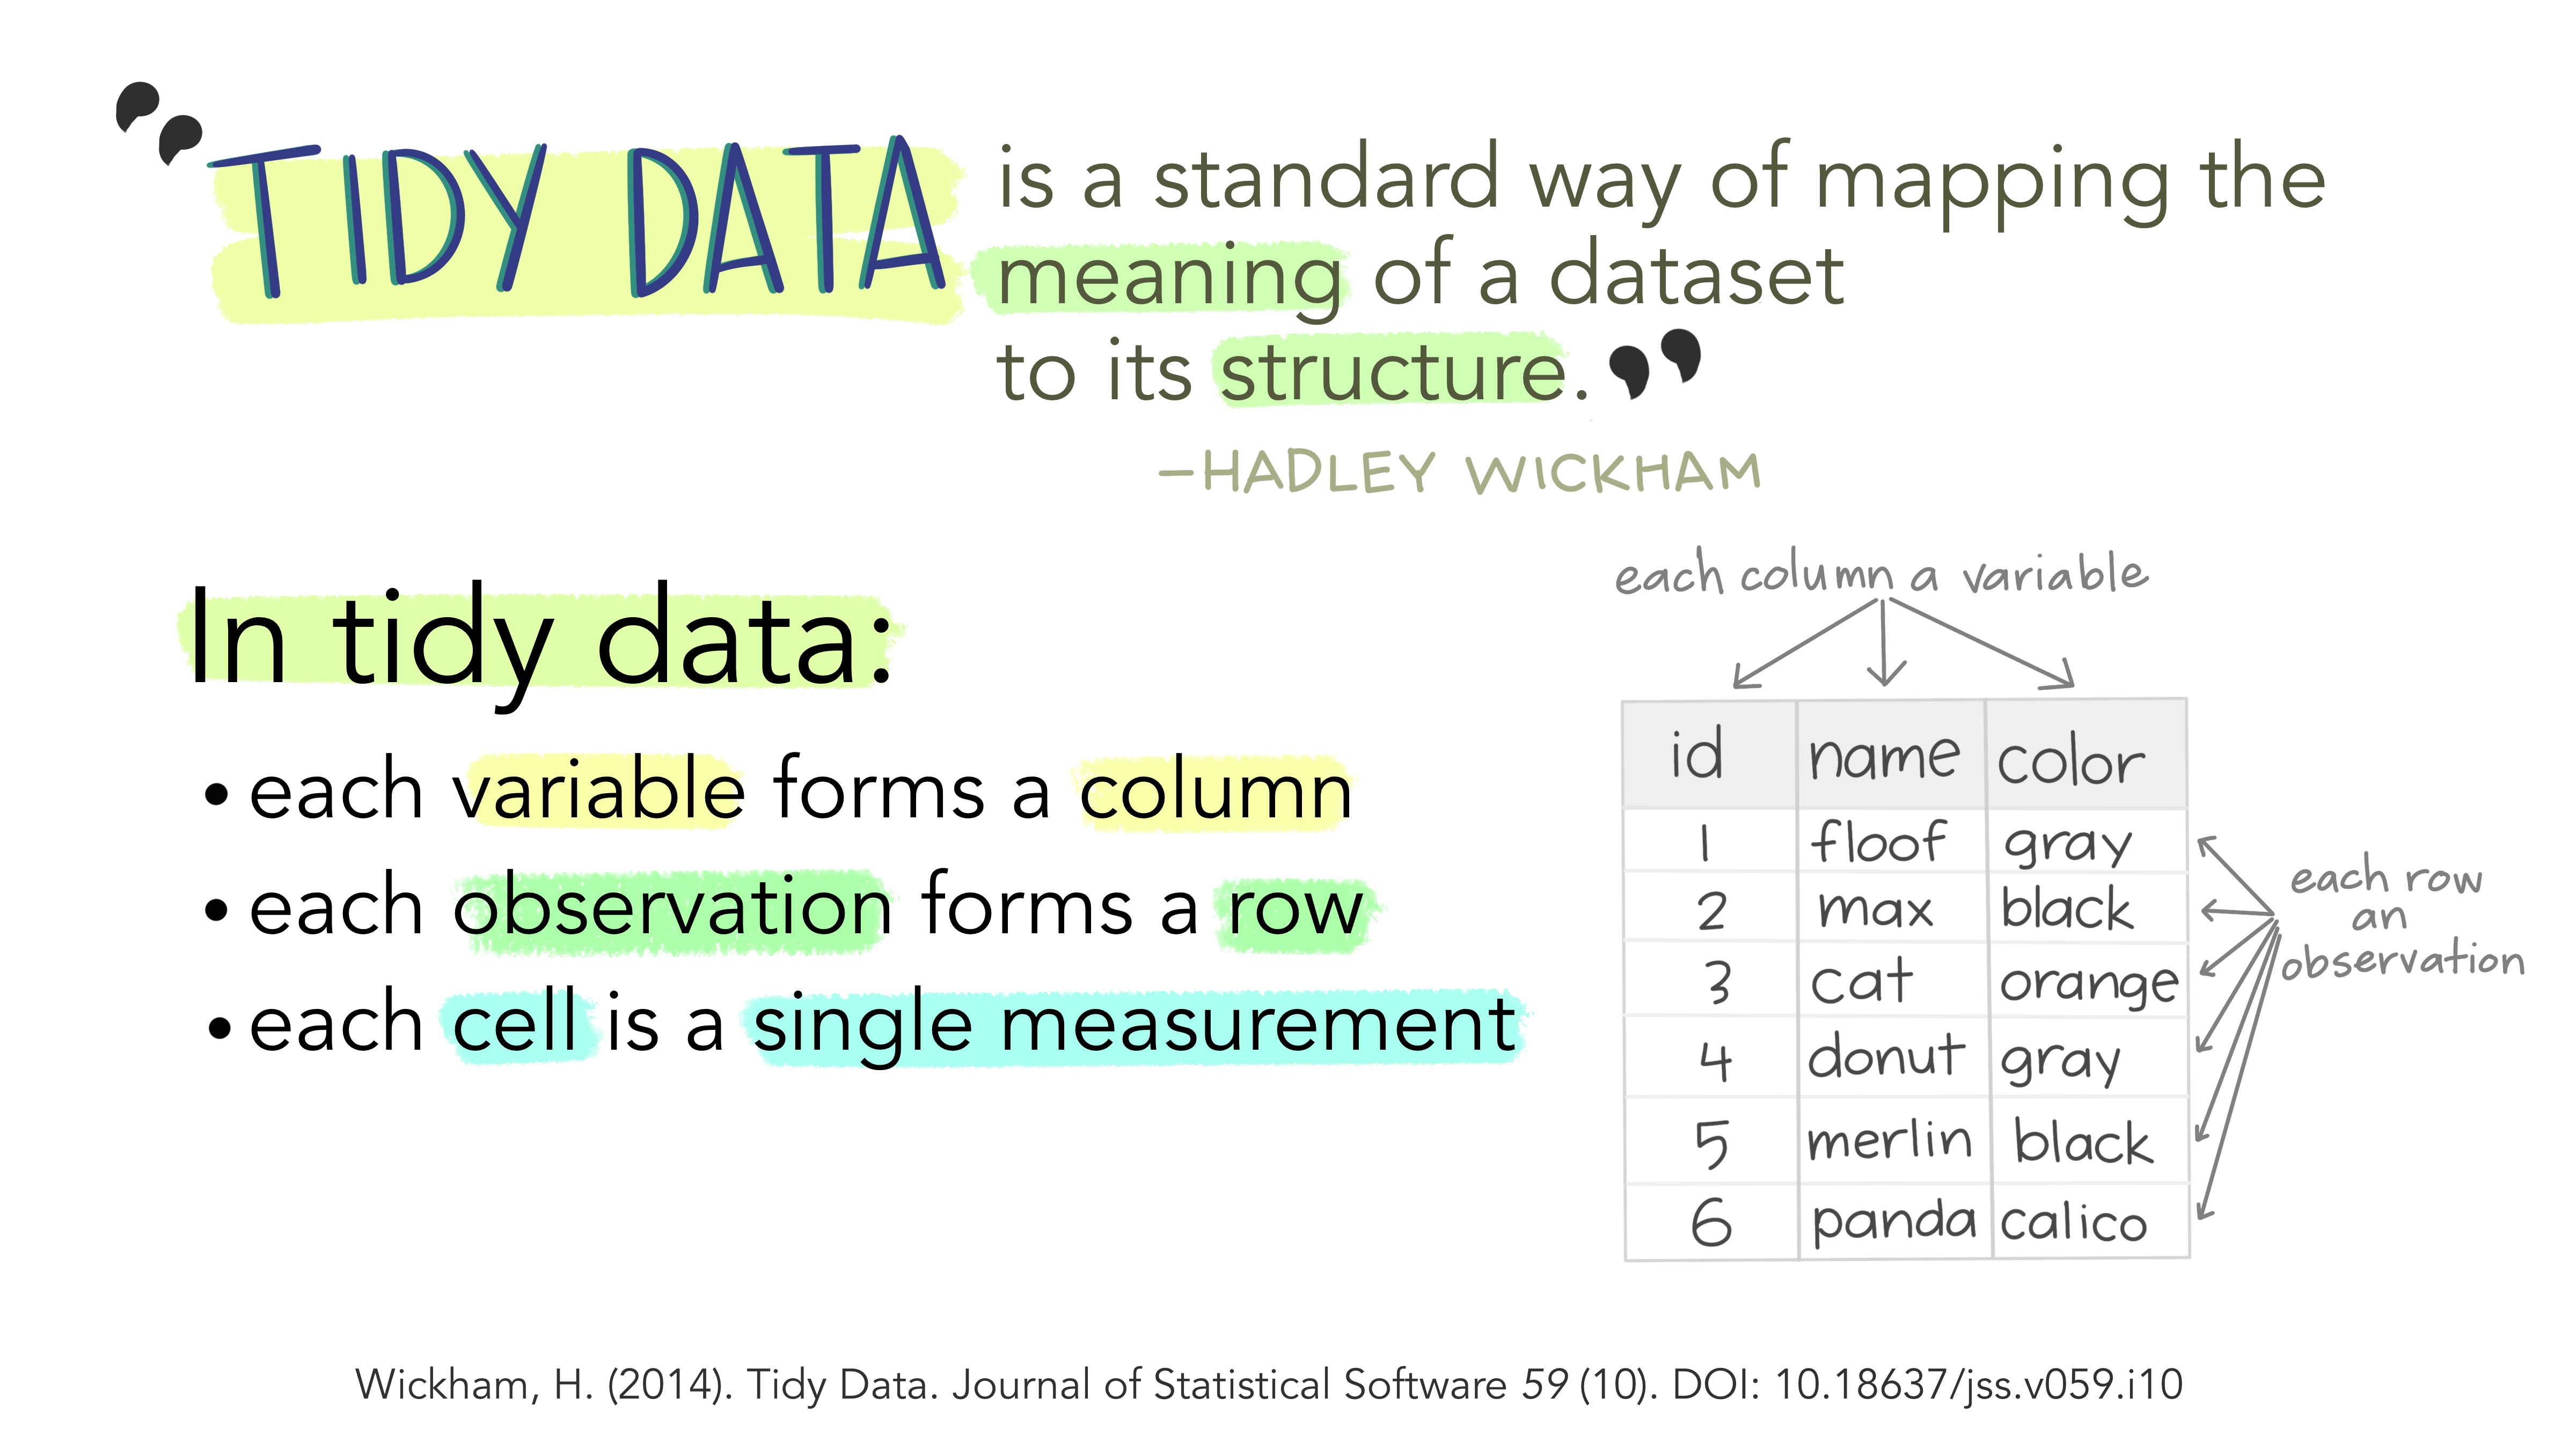
Tidy data is a way to describe data that’s organized with a particular structure – a rectangular structure, where each variable has its own column, and each observation has its own row (Wickham 2014).
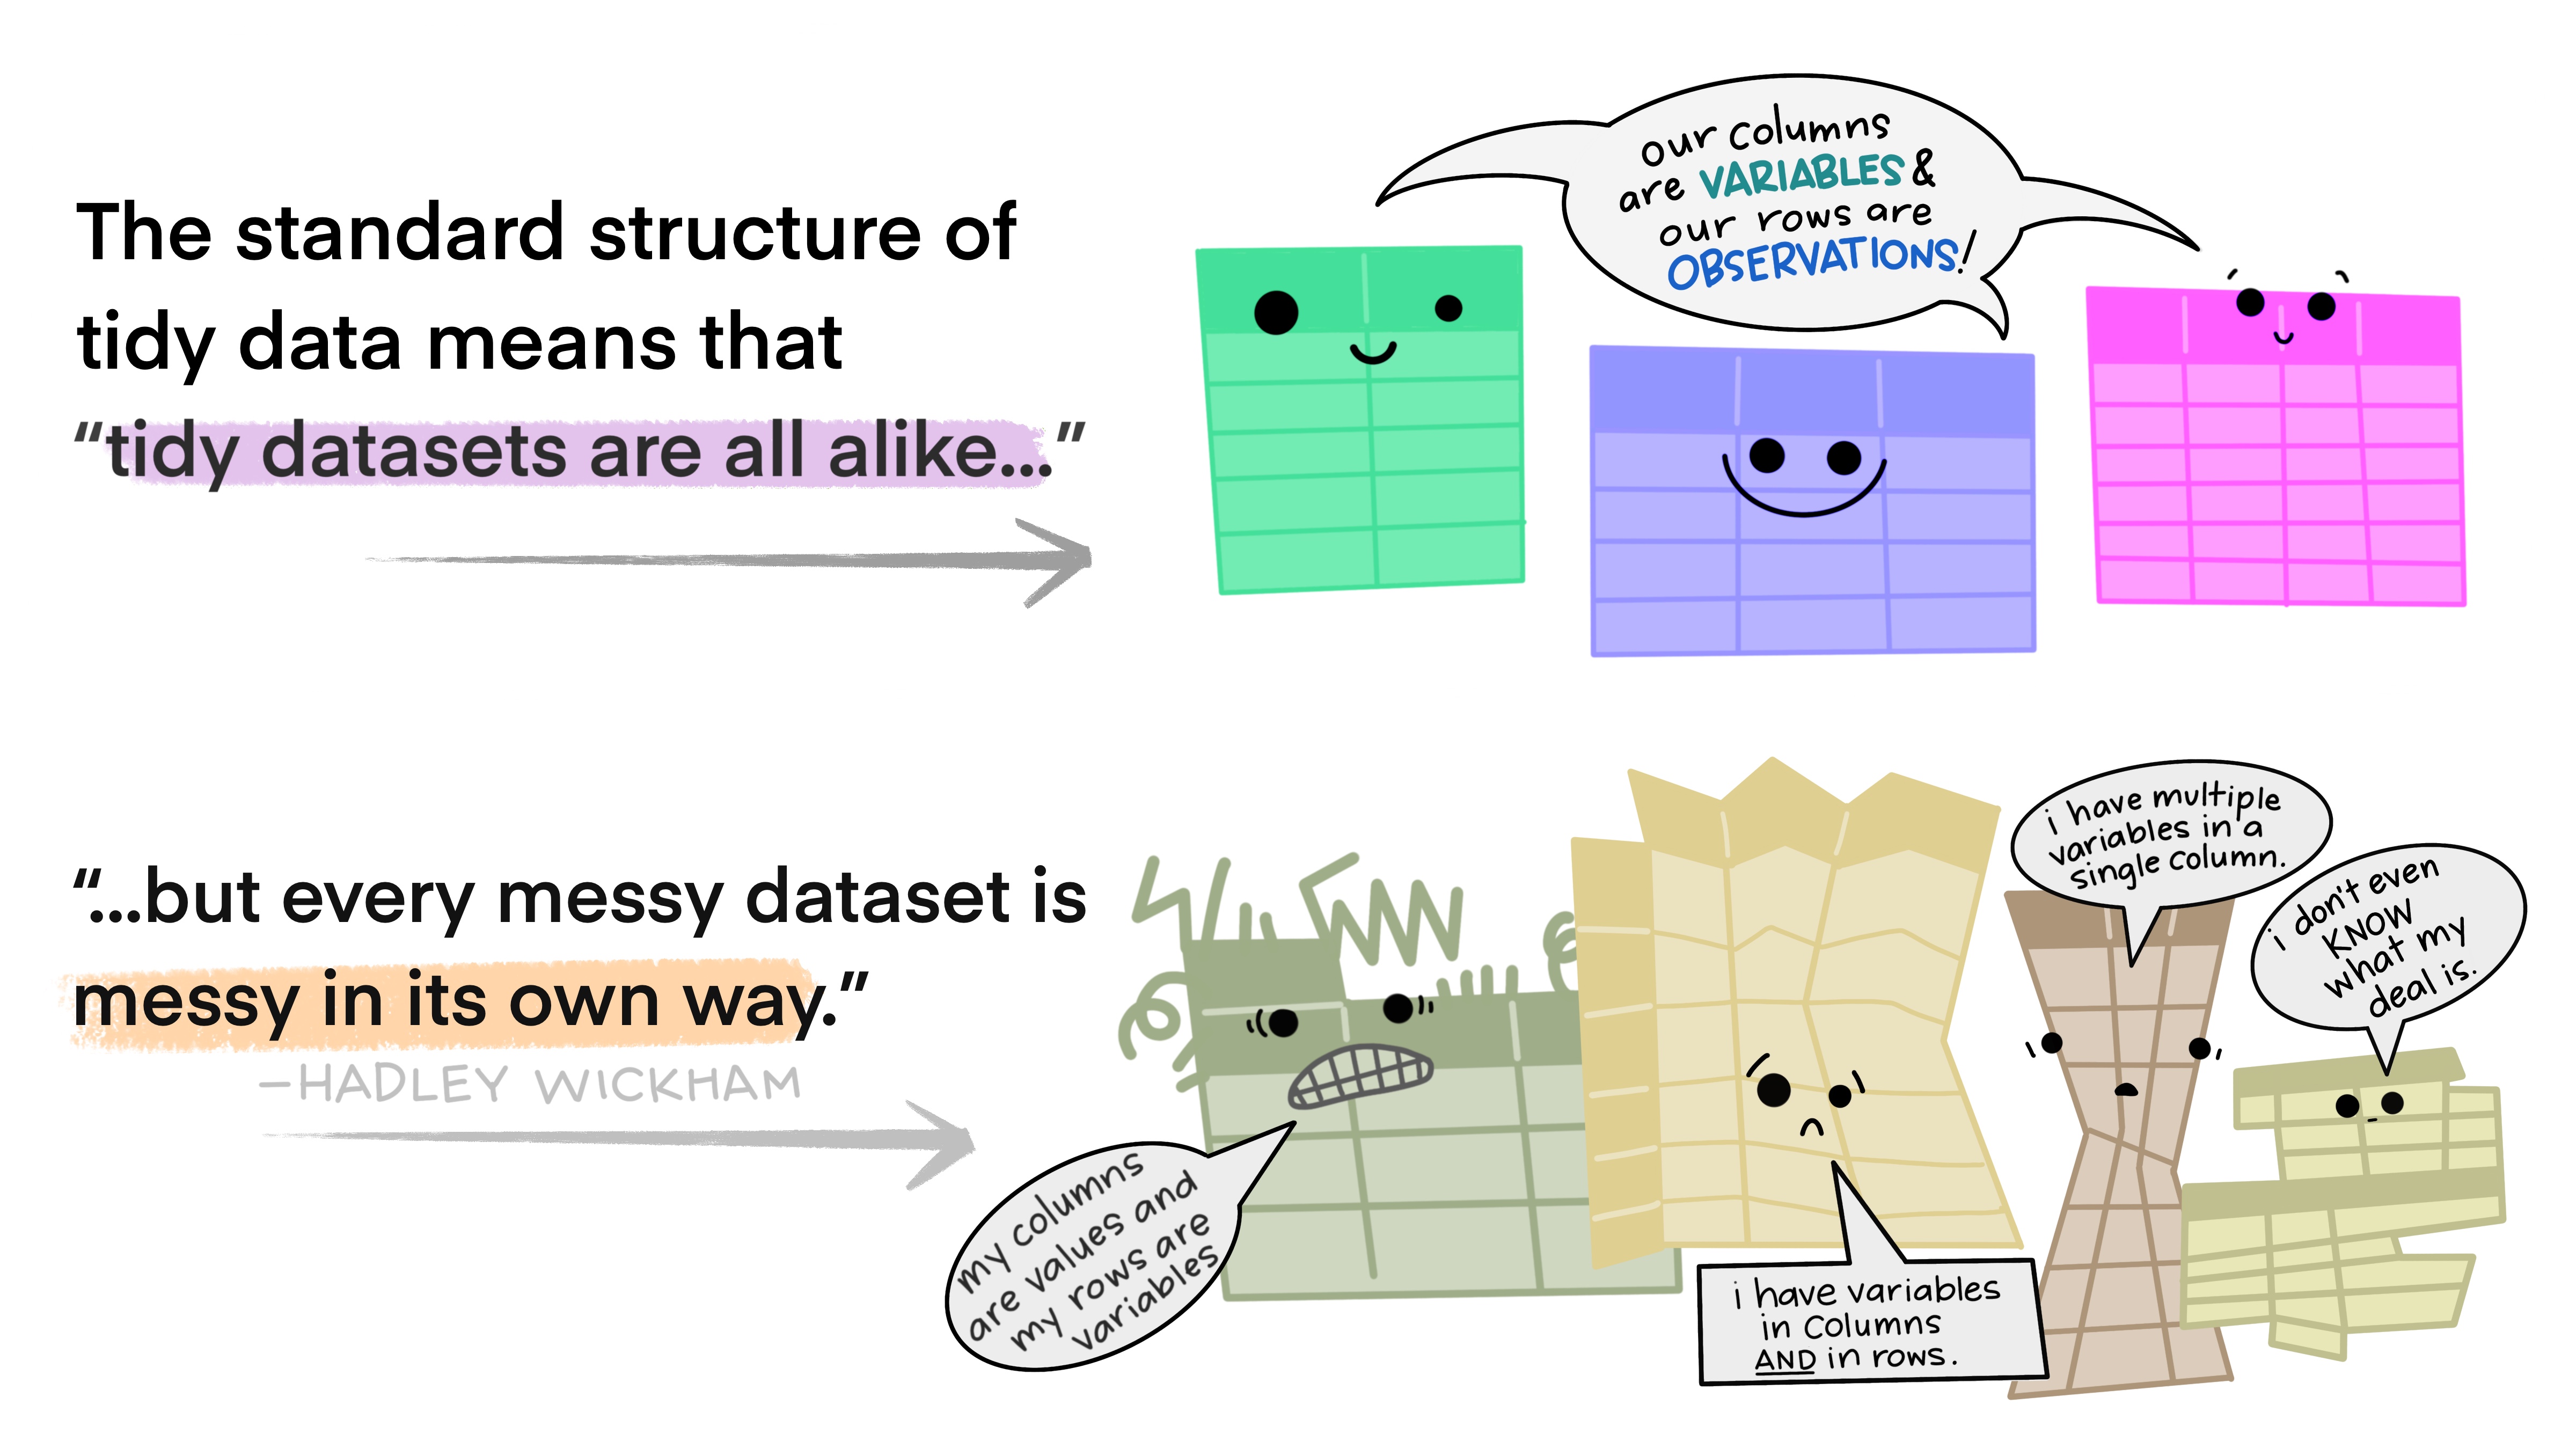
 This standard structure of tidy data led Hadley Wickham to describe it the way Leo Tolstoy describes families. Leo says “Happy families are all alike; every unhappy family is unhappy in its own way”. Similarly, Hadley says “tidy datasets are all alike, but every messy dataset is messy in its own way”.
 Tidy data allows you to be more efficient by using existing tools deliberately built to do the things you need to do, from subsetting portions of your data to plotting maps of your study area. Using existing tools saves you from building from scratch each time you work with a new dataset (which can be time-consuming and demoralizing). And luckily, there are a lot of tools specifically built to wrangle untidy data into tidy data (for example, in the tidyr package). By being more equipped to wrangle your data into a tidy format, you can get to your analyses faster to start answering the questions you’re asking.
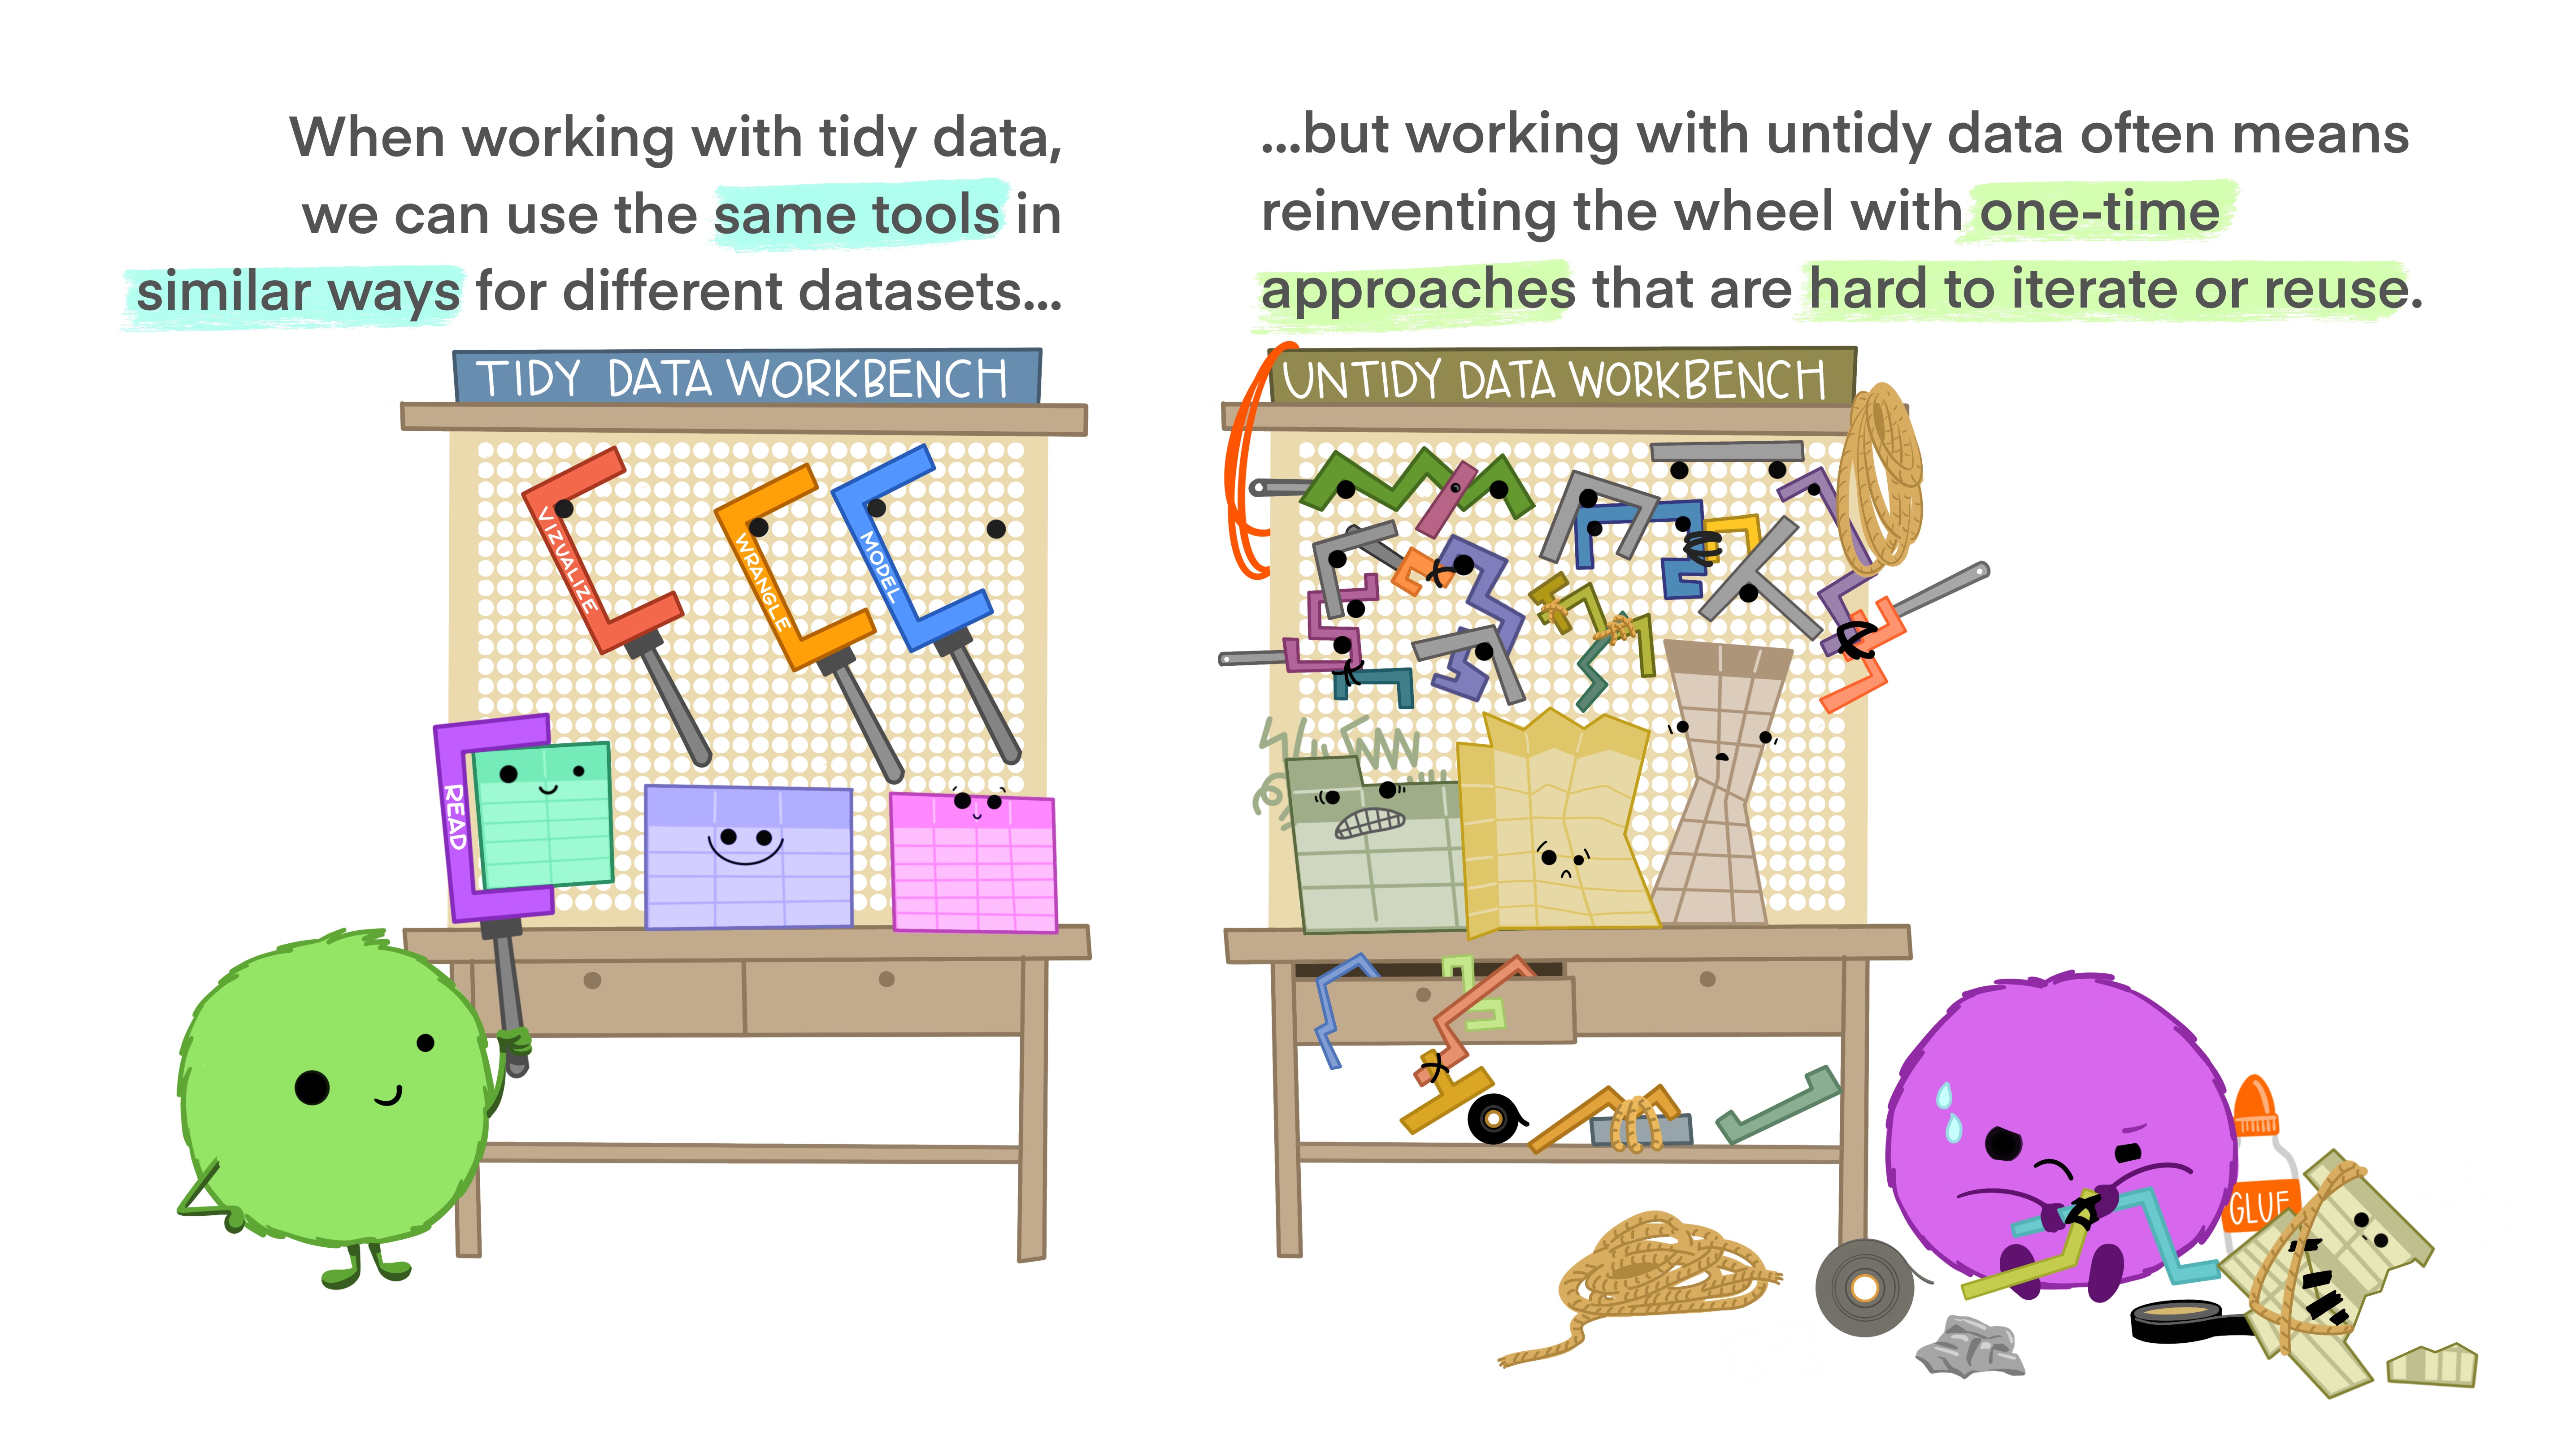
Tidy data makes it easier to collaborate because our friends can use the same tools in a familiar way. Whether thinking about collaborators as current teammates, your future self, or future teammates, organizing and sharing data in a consistent and predictable way means less adjustment, time, and effort for all.

Learn more about tidy data:
Wickham, H (2014). Tidy Data. Journal of Statistical Software 58 (10). jstatsoft.org/v59/i10/
“Informal and code-heavy version” of the full paper above: tidyr.tidyverse.org/articles/tidy-data
Broman, KW and KH Woo (2018). Data Organization in Spreadsheets. The American Statistician 72 (1). Available open access as a PeerJ preprint.
Grolemund, G & Wickham, H (2016). R for Data Science: Ch 12 (Tidy Data)