
Chapter 7 Missing Values
How to identify missing values? (NA’s):
We distinguish 3 kinds of NA’s:
- Missing Completely at Random (MCAR)
- Missing at Random (MAR)
- Missing Not at Random (MNAR)
HOW TO DETECT MISSING VALUES and HANDLE THEM?
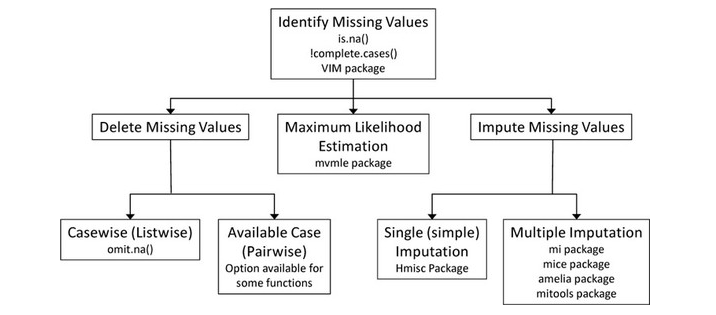
In case of missing data, we have three strategies to choose from:
Omitting observations with missing values.
The use of incomplete observations in the model construction process and / or in the restoration mode.
Supplement (imputation) of missing data.
7.1 Deleting NA’s
- Removing missing data by cases or pairs.
The default way to remove missing data when performing calculations is to exclude cases where there is no measurement for even one variable. This method is called the removal of missing data cases. However, if the missing cases are distributed randomly between different observations, this method can significantly reduce the sample size, and in the extreme case even reduce it to zero. The solution for such situations is the method of removing missing data in pairs. In many situations this method can be considered appropriate, especially when the missing data is scarce (eg 10%) and when they are evenly distributed between cases and variables. Sometimes, however, the paired removal method can lead to serious complications.
For example, as a result of the hidden systematic distribution of missing data, biased results may be created because different coefficients are calculated on the basis of different subsets of data. Apart from the fact that false conclusions can be drawn from the evaluation of such an analysis, serious problems may also arise in the situation when we use such analysis as an input to other analyzes. Therefore, if someone uses the method of removing missing data in pairs, he should examine the distribution of missing data in the observation matrix for the occurrence of some systematic systems.
How to detect errors caused by removing missing data in pairs?
If the method of removing missing data in pairs does not introduce specific disturbances to the final results of the analysis, then all descriptive statistics for a given variable should be similar to each other. If, however, there are differences between them, one can suspect that there are deviations.
- Deleting missing data in pairs and replacing with the mean.
Another commonly used method, avoiding data loss, in case of removing missing data, is so-called replacing missing data by means of median (average replacement). Substitution with average value has both advantages and disadvantages compared to pairs removal. The main advantage is that it allows you to generate internally consistent results. The basic disadvantages include:
- Average replacement artificially reduces the variability of results, and the relative percentage of this reduction is proportional to how many observations are missing for a given feature (i.e., the more cases are missing, the more accurately the average values are added to the data set);
- Because data gaps are replaced with artificially created observations, corresponding to the average, so the average replacement can significantly change the correlation values, especially inflate them.
7.2 Multiple Imputations
Multiple imputation (MI) provides an approach to missing values that’s based on repeated simulations. MI is frequently the method of choice for complex missing values problems.
In MI, a set of complete datasets (typically 3 to 10) is generated from an existing dataset containing missing values. Monte Carlo methods are used to fill in the missing data in each of the simulated datasets. Standard statistical methods are applied to each of the simulated datasets, and the outcomes are combined to provide estimated results and confidence intervals that take into account the uncertainty introduced by the missing values.
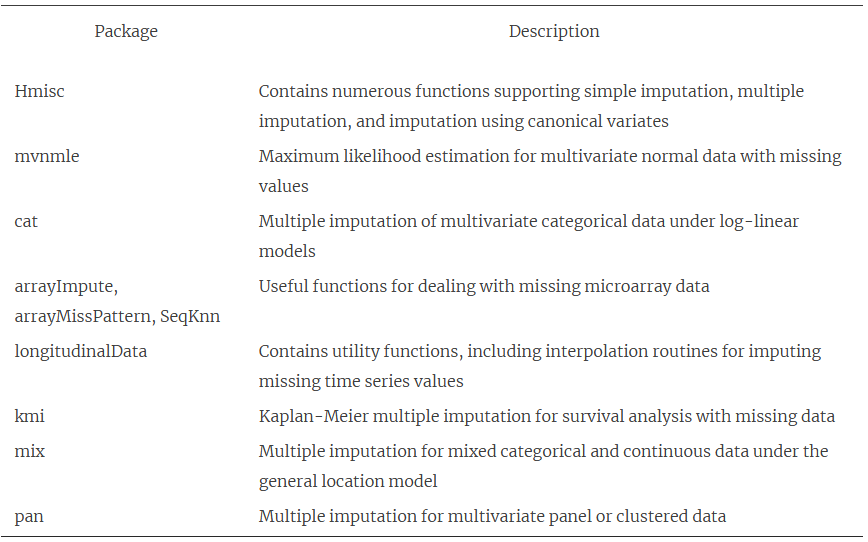
Good implementations are available in R through the Amelia, mice, and mi packages.
R supports several other approaches for dealing with missing data. Although not as broadly applicable as the methods described thus far, the packages described below offer functions that can be quite useful in specialized circumstances.
Most statistical methods assume that the input data is complete and doesn’t include missing values (for example, NA, NaN, Inf). But most datasets in real-world settings contain missing values. Therefore, you must either delete the missing values or replace them with reasonable substitute values before continuing with the desired analyses. Often, statistical packages will provide default methods for handling missing data, but these approaches may not be optimal. Therefore, it’s important that you understand the various approaches available, and the ramifications of using each.